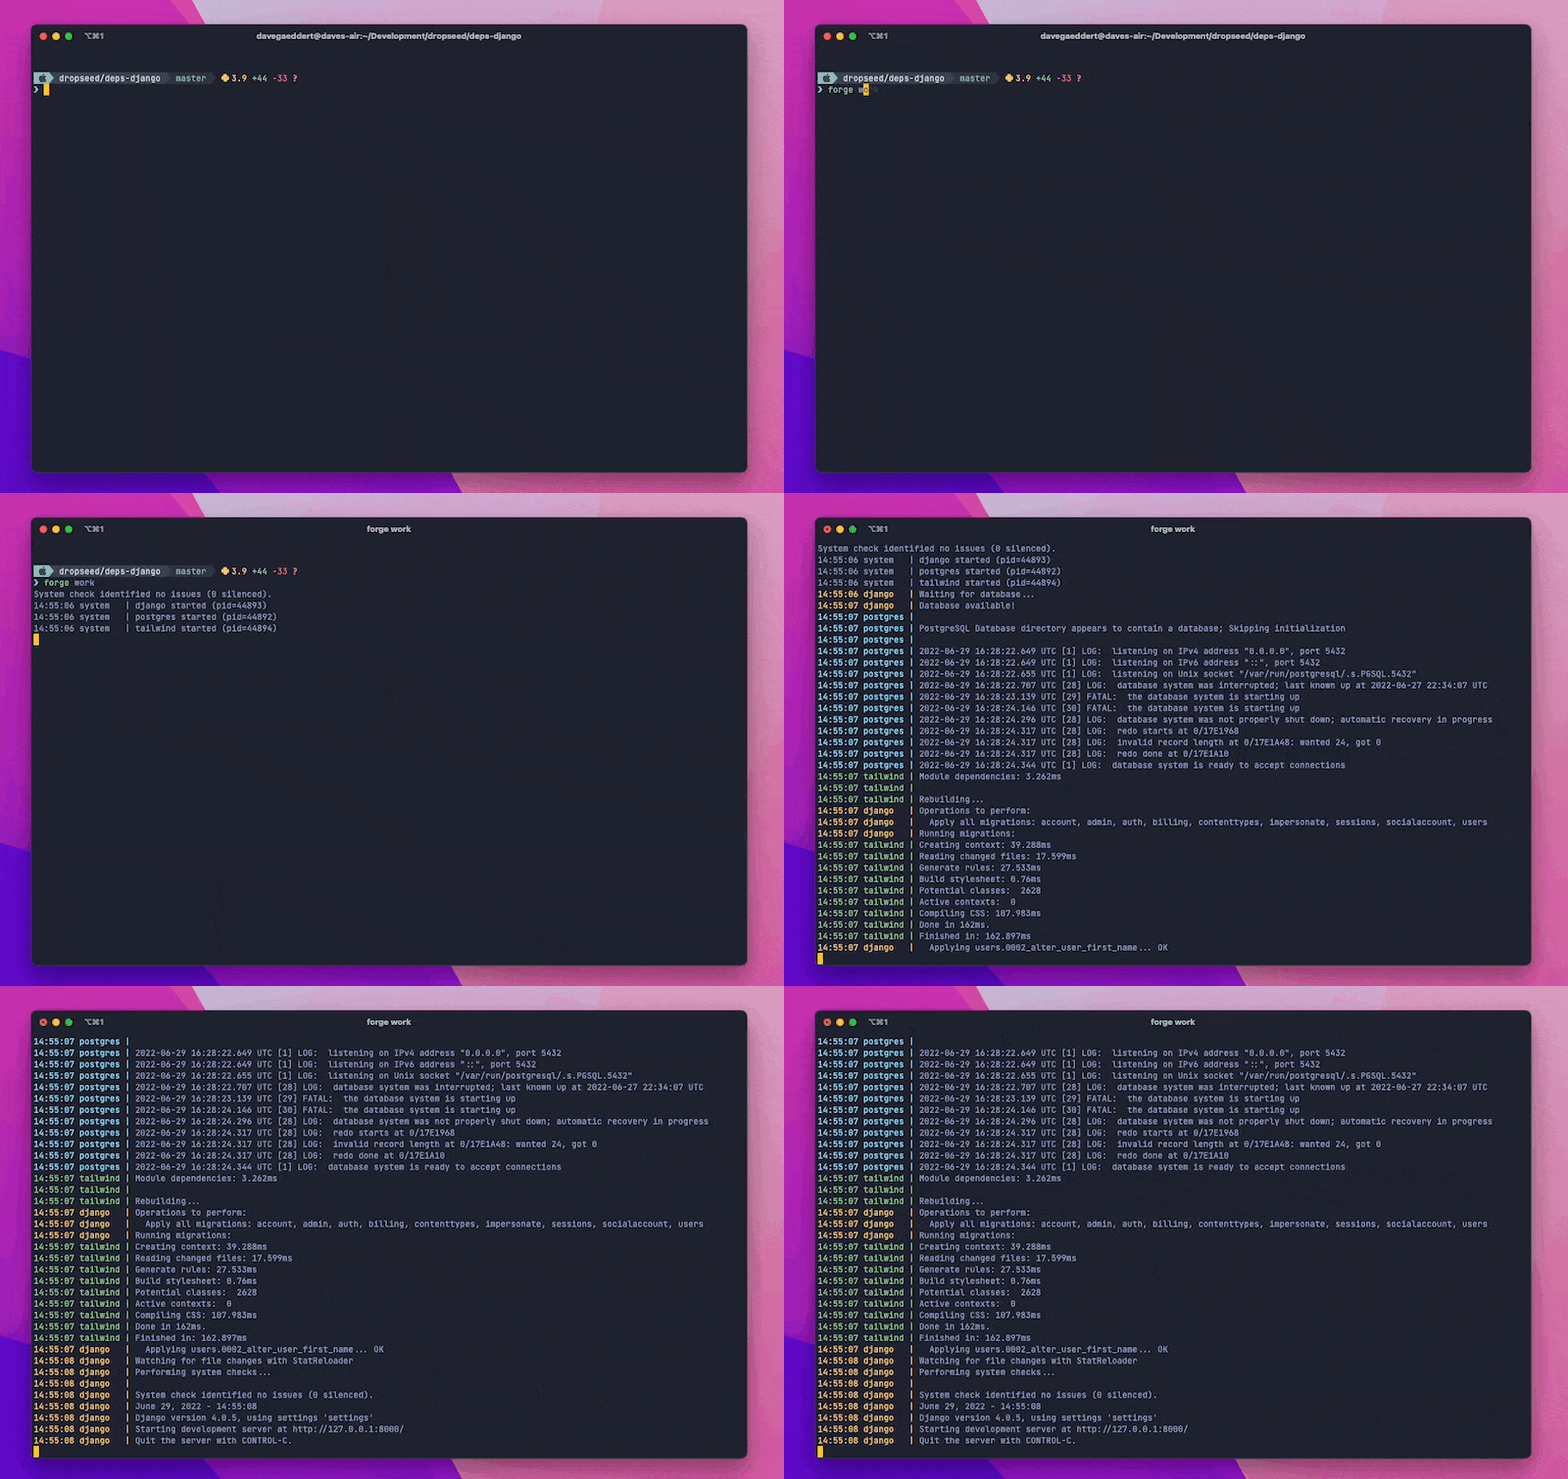
forge-work
A single command to run everything you need for local Django development.

The following processes will run simultaneously (some will only run if they are detected as available):
manage.py runserver(and migrations)forge-db start --logsforge-tailwind compile --watchnpm run watchstripe listen --forward-tongrok http --subdomaincelery worker
It also comes with debugging tools to make local debugging easier with VS Code.
Installation
First, install forge-work from PyPI:
pip install forge-work
Now instead of using the basic manage.py runserver (and a bunch of commands before and during that process), you can simply do:
forge work
Development processes
Runserver
The key process here is still manage.py runserver.
But, before that runs, it will also wait for the database to be available and run manage.py migrate.
forge-db
If forge-db is installed, it will automatically start and show the logs of the running database container.
forge-tailwind
If forge-tailwind is installed, it will automatically run the Tailwind compile --watch process.
package.json
If a package.json file is found and contains a watch script,
it will automatically run.
This is an easy place to run your own custom JavaScript watch process.
Stripe
If a STRIPE_WEBHOOK_PATH env variable is set then this will add a STRIPE_WEBHOOK_SECRET to .env (using stripe listen --print-secret) and it will then run stripe listen --forward-to <runserver:port/stripe-webhook-path>.
Ngrok
If an NGROK_SUBDOMAIN env variable is set then this will run ngrok http <runserver_port> --subdomain <subdomain>.
Note that ngrok will need to be installed on your system already (however you prefer to do that).
Celery
If a CELERY_APP env variable is set, then an autoreloading celery worker will be started automatically.
Debugging
Since forge work runs multiple processes at once, the regular pdb debuggers can be hard to use.
Instead, we include microsoft/debugpy and an attach function to make it even easier to use VS Code's debugger.
First, import and run the debug.attach() function:
class HomeView(TemplateView):
    template_name = "home.html"

    def get_context_data(self, **kwargs):
        context = super().get_context_data(**kwargs)

        # Make sure the debugger is attached (will need to be if runserver reloads)
        from forgework import debug; debug.attach()

        # Add a breakpoint (or use the gutter in VSCode to add one)
        breakpoint()

        return context
When you load the page, you'll see "Waiting for debugger to attach...".
Add a new VS Code debug configuration (using localhost and port 5768) by saving this to .vscode/launch.json or using the GUI:
// .vscode/launch.json
{
    // Use IntelliSense to learn about possible attributes.
    // Hover to view descriptions of existing attributes.
    // For more information, visit: https://go.microsoft.com/fwlink/?linkid=830387
    "version": "0.2.0",
    "configurations": [
        {
            "name": "Forge: Attach to Django",
            "type": "python",
            "request": "attach",
            "connect": {
                "host": "localhost",
                "port": 5678
            },
            "pathMappings": [
                {
                    "localRoot": "${workspaceFolder}",
                    "remoteRoot": "."
                }
            ],
            "justMyCode": true,
            "django": true
        }
    ]
}
Then in the "Run and Debug" tab, you can click the green arrow next to "Forge: Attach to Django" to start the debugger.
In your terminal is should tell you it was attached, and when you hit a breakpoint you'll see the debugger information in VS Code. If Django's runserver reloads, you'll be prompted to reattach by clicking the green arrow again.
